07:00 hours placement of air sampler pumps A2, A3, A4, and A5
07:15 hours wind speed and direction: 0 to 1 m/s from ESE
07:30 hours placement of sprinkler(s) – dust suppression areas 1 and 2, and grassed areas adjacent to area 4.
08:00 hours discussion with WSP consultant re management of site up until the arrival of geo-fabric contractors Wednesday next week. Continued air monitoring and dust suppression now that hot spot areas are exposed earth.
09:00 hours movement of sprinklers to ensure coverage across areas 1 and 2.
09:30 hours aerial photography:
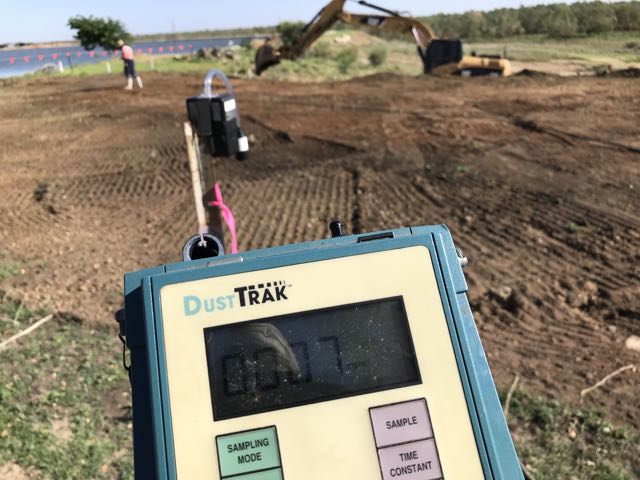
10:30 hours check of PM10 levels upwind and downwind found to be approximately the same i.e. between 0 and 0.20 mg/m3
12:00 hours check of air sampling pumps and activities.
14:00 hours wind has picked up with strength between 0 and 3 m/s ESE
15:00 hours PM10s upwind and downwind of job site approximately the same, no change in direction and strenght.
Results:
Little activity on the worksites, unloading of clean fill continues, and dust suppression of all areas using hoses.
Wind strength and direction 10:00 to 15:00 hours constant ESE 0 to 2 m/s
PM10s upwind and downwind 10:00 to 15:00 hours constant between 0 and 0.3 mg/m3 i.e. little difference between upwind and downwind values.
07:00 hours placement of air samplers at A1, A2, A3, A4, A5, and A6
07:15 hours check of wind speed and direction: 0 to 1 m/s ESE
07:30 hours check of dust levels in real time (PM10s): 0 to 0.010mg/m3
08:hours check of air sampling pumps and activities
10:00 hours check of PM10s: remaining between the range of 0 to 0.010 mg/m3
12:00 check of air sampling and activities, more water on area 1 and 2 were required to keep dust down.
13:00 hours check of PM10s: between 0 and 0.20 mg/m3. Slight increases due to increasing wind strength. Levels upwind compared to downwind of job sites approximately the same i.e. no dust migrating offsit.
14:30 hours check of air sampling pumps and activities.
15:00 hours wind strength has subsided to between 0 to 2 m/s
07:00 to 07:30 hours placement of 6 air samplers at A1, A2, A3, A4, A5, and A6
08:00 hours wind speed and strength 0 to 1 m/s ESE
08:15 hours real-time dust survey all areas PM10s between 0.005 and 0.010 mg/m3
08:30 WSP audit of Environics
09:00 hours wind speed and strength 0 to 2 m/s ESE
10:00 hours check of flow rates all sampling pumps, satisfactory
10:15 hours real-time dust survey all areas PM10s between 0.005 and 0.010 mg/m3
10:30 hours wind speed and strength 0 to 4 m/s ESE to S i.e. wind has increased
11:00 real-time dust survey all areas PM10s between 0.010 and 0.040 mg/m3. Upwind values approximate down wind values i.e. increasing wind has picked up dust across the site. Instruction to Removalist to increase dust suppression
12:00 hours check of airflow rates all samplers, satisfactory
06:45 hours wind strength and direction: 0 to 1 m/s WSW
07:00 hours air samplers at A2, A5, and A6, adjacent to work in progress, and A7 open area adjacent to entry of hospital (no work in progress at this location)
06:45 hours wind strength and direction: 0 to 1 m/s WSW
07:00 hours air samplers at A2, A5, and A6, adjacent to work in progress, and A7 open area adjacent to entry of hospital (no work in progress at this location)
07:30 hours aerial photographs:
DCIM\100MEDIA\DJI_0009.JPG
08:25 hours air sampler at A1 adjacent to work in progress.
Real-time dust levels (PM10) very low i.e. 0.001 to 0.o10 mg/m3 — Sample ID 18
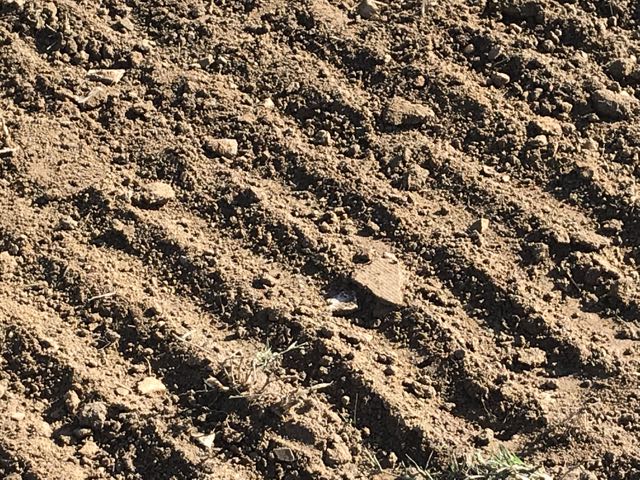
08:45 hours detailed inspection of soil at area 1.
Some fragments of bonded A/C sheeting found:
Fragment of bonded A/C sheeting center of photograph
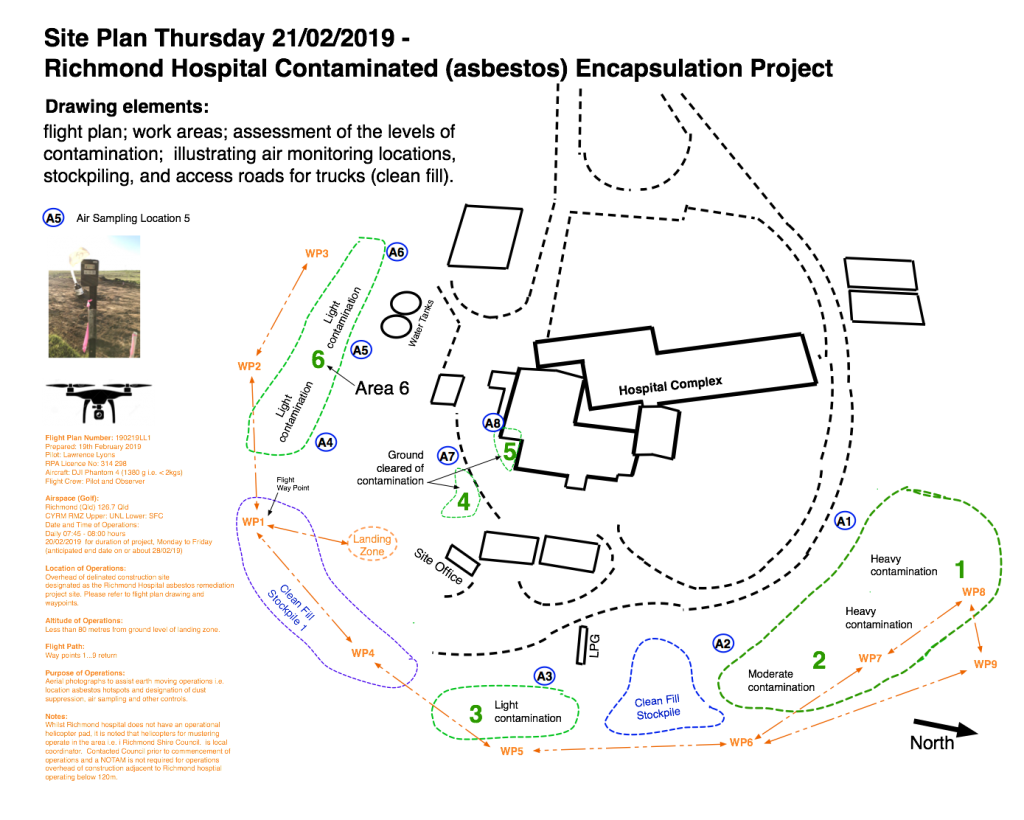
PDF download of site plan Thursday the 21st February 2019:
06:50 wind speed 0 to 1 m/s WNW – PM10s across site less than 0.010 mg/m3. No significant downwind variations compared to upwind dust levels.
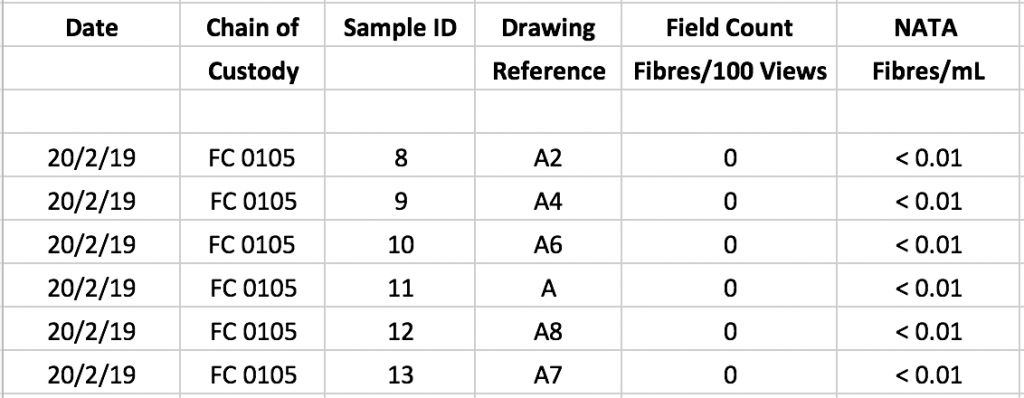
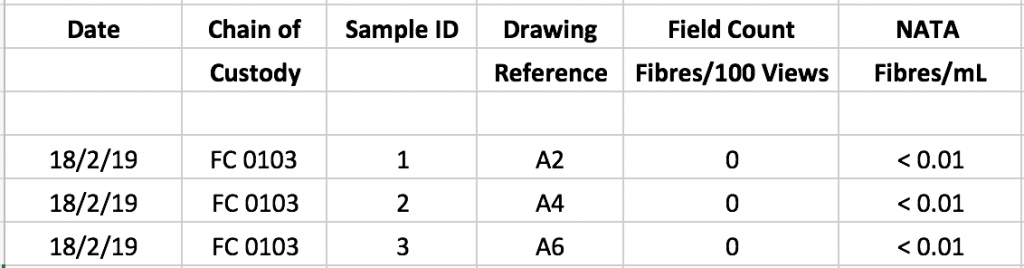
07:00 hours air samplers ID 08..11 at A2, A4, A6, A1 – CoC number 0105
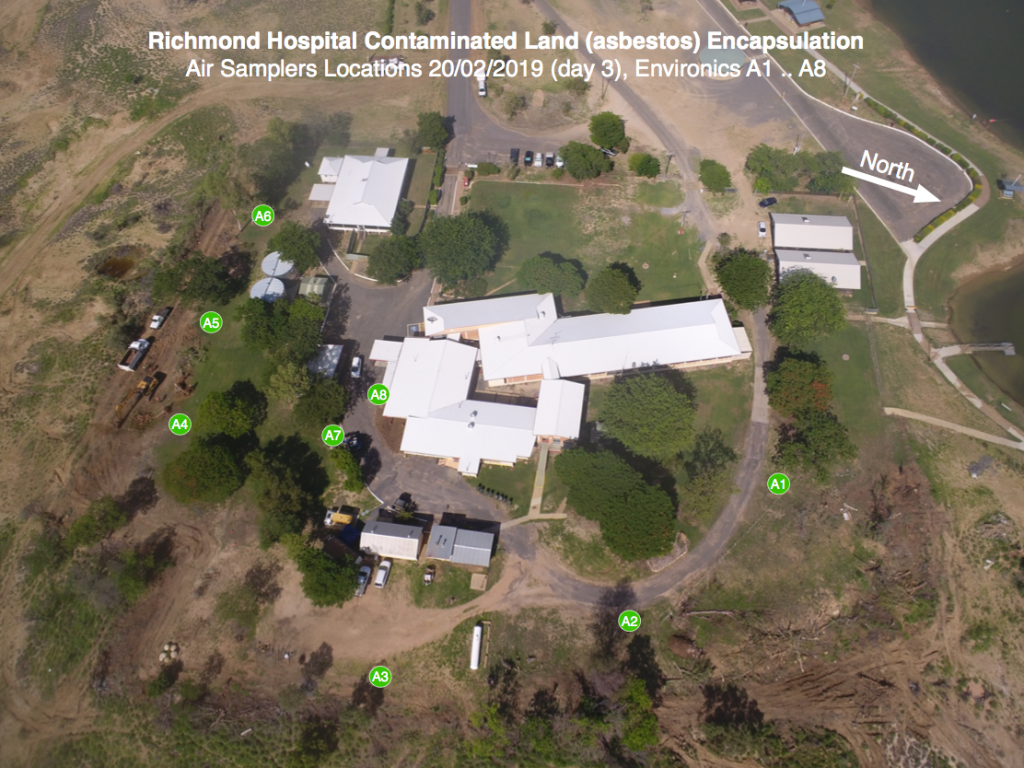
Air Sampler Locations as at Wednesday the 20th February 2019
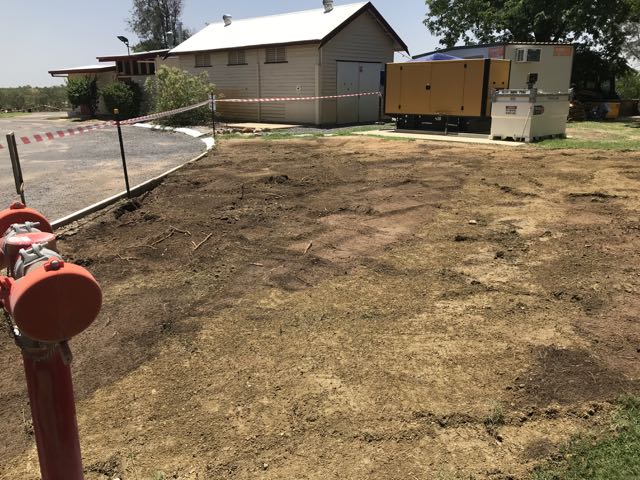
08:00 hours air sampler ID 12 at A8 – area 5 works in progress, sample added to CoC number 0105. PM10 levels adjacent to works remained below 0.03 mg/m3.
Area 5 Works Wednesday 20th February 2019 (ID 12 08:00 to 11:00 hours)
09:00 hours wind speed 0 to 1.5 m/s NW. PM10s have slightly increased, however no significant difference between upwind and downwind measurements with dust levels at 0.010 to 0.03 mg/m3 across the site.
10:00 hours wind speed 0 to 1 m/s NW. No changes in PM10 levels i.e. as above.
11:30 hours commencement of works at area 4. Sample ID 12.
13:00 wind speed remains low from NW. No changes in PM10 levels. Note 1. mower has broken down.
13:30 completion of works at area 4:
Area 4 – Sample ID 13
Maximum PM10 measured during work in progress : 0.02 mg/m3 – (refer to note 4 above) Results for PM10s measured are satisfactory i.e. consistent with background levels upwind of the job site.
10:30 hours background dust levels (PM10) no work in progress 0.010 to 0.020 mg/m3
11:00 hours wind speed 0 to 2 m/s northerly
11:15 hours 4 air samplers placed at static locations along exclusion zone i.e. between work areas and hospital.
11:30 hours wind speed 0 to 2 m/s northerly – PM10 levels variable from 0.10 to 0.019 mg/m3 at 12m downwind from work in progress. Dust monitoring on approach to machines pulling trees and fencing an increase within 10m of machine o.015 to 0.0.30 mg/m3 for the current wind speed.
General instruction recommendation to project manager, all persons working within 10m of an operating machine to wear P2 dust mask as a minimum. This may be upgrade when soil is significantly disturbed and if soil has dried out.
Note 1: soil is not currently being disturbed. Work restricted to removing barbed wire and wire off fencing ahead of machine pulling fencing from the ground. Mowing north of hosptial. Note 2: the moisture in the soil is significant i.e. dust is not being readily liberated.
12:45 hours meeting all workers onsite re controls including wearing of a respiratory mask for the present level of work.
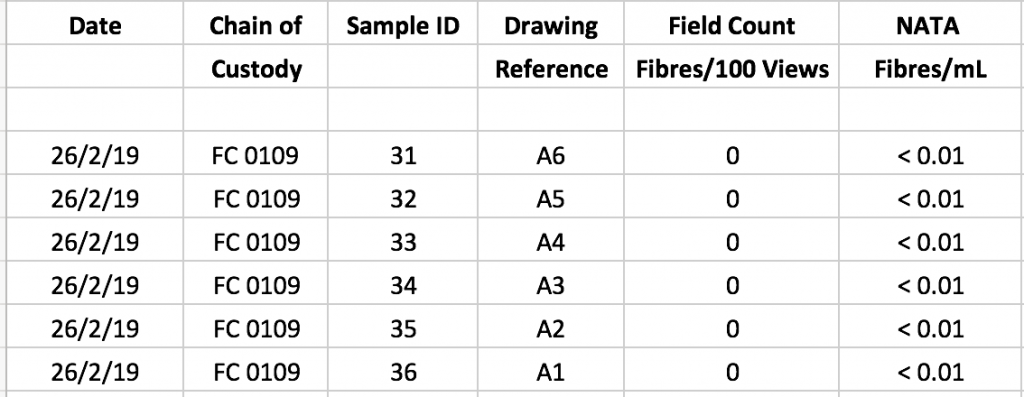
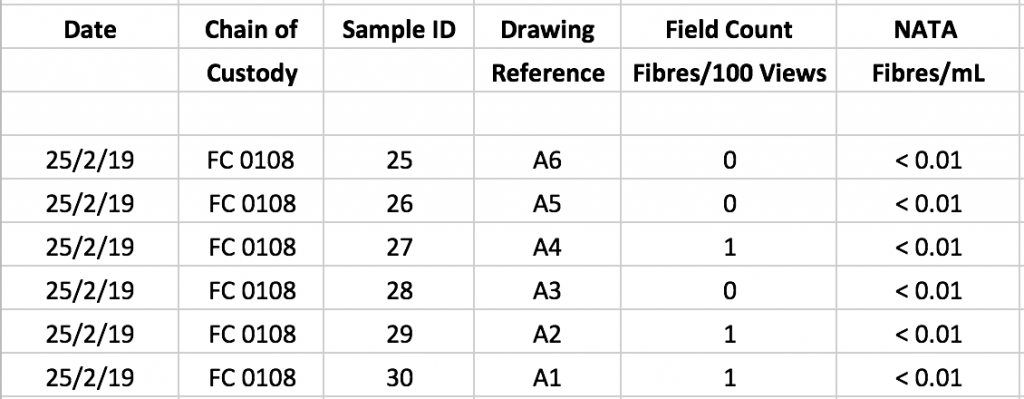
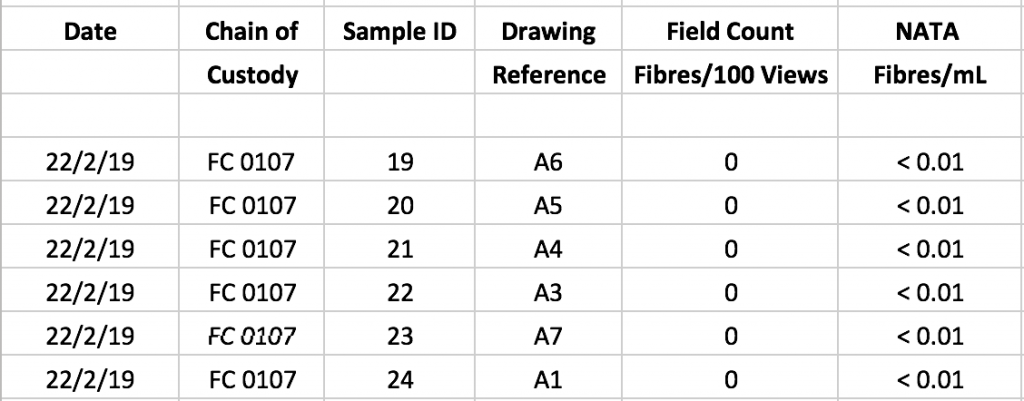
Air Monitoring Results:
Note 1:
It should be emphasised that in mixed dust situations the presence of other fibres and fibre-like particles may interfere with the interpretation of any results. The MFM does not distinguish between the different types of fibres, including organic fibres and synthetic mineral fibres. (Guidance Note on the Membrane Filter Method for the Estimation of Airborne Asbestos Fibres, 2nd Edition, 2005 [NOHSC:3003: (2005)])
Note 2:
If the fibre count is less than 10 fibres per 100 fields the count is not significantly above that of background (Guidance Note on the Membrane Filter Method for the Estimation of Airborne Asbestos Fibres, 2nd Edition, 2005 [NOHSC:3003: (2005)]).
Note 3:
For nuisance dust, the National Environment Protection Measure (NEPM) 24-hour guidance goal of 50 μg/m3 for PM10 (particulate matter with an equivalent aerodynamic diameter of 10 μm or less) should apply (NEPM 2003).
Guidelines for the Assessment, Remediation and Management of Asbestos-Contaminated Sites in Western Australia – May 2009
Note 4:
The physical properties which best differentiated crocidolite fibres from other types of asbestos and which had higher values determined for crocidolite fibres than those obtained for the other types, were median aspect ratio and the proportion of long thin fibres <0-2 ,um in diameter and >5 um in length.
British Journal of Industrial Medicine 1983; 40:273-279
Project classification is “mixed dust” i.e. respirable fibres that may or may not be asbestos.
Maximum PM10 measured during work in progress : 0.03 mg/m3 – (refer to note 4 above) Results for PM10s measured are satisfactory i.e. consistent with background levels upwind of the job site.
10:30 hours pre-start site meeting of stakeholders
12:00 hours inspection of site by stakeholders
14:30 – 18:30 hours background air monitoring
Contact phone numbers
Maximum PM10 measured during work in progress: 0.024 mg/m3 – Results for PM10s measured are satisfactory i.e. consistent with background levels upwind of the job site.
Based on the weather and flooding in Townsville and Richmond, work will not commence next week on the 11th Feb. I have contacted the client and Superintendent and suggested delaying 1 week, with a revised start date of Monday 18th Feb, although I note that this may be conservative and need to be pushed back further (TBA).
Once the revised start date is agreed, I will contact everyone and let you know